
In Part 1 and Part 2, I talked about three concepts for Generative AI:
- The Generative AI Tech Stack
- The GenAI Knowledge Flywheel
- Step 1 of my GenAI Playbook
Those three things cover most of the business conversations you hear about GenAI these days.
But this glosses over a really important digital concept, that I have been trying to figure out. And that is rate of learning. I think the key question for digital and AI strategy is:
How does machine learning change “rate of learning and adaptation” as an operating activity? And as a moat?
In my Moats and Marathons books, I wrote three chapters on rate of learning and adaptation as a concept. Businesses are just getting more intelligent. And more adaptation. This increasingly cuts across almost every aspect of digital business.
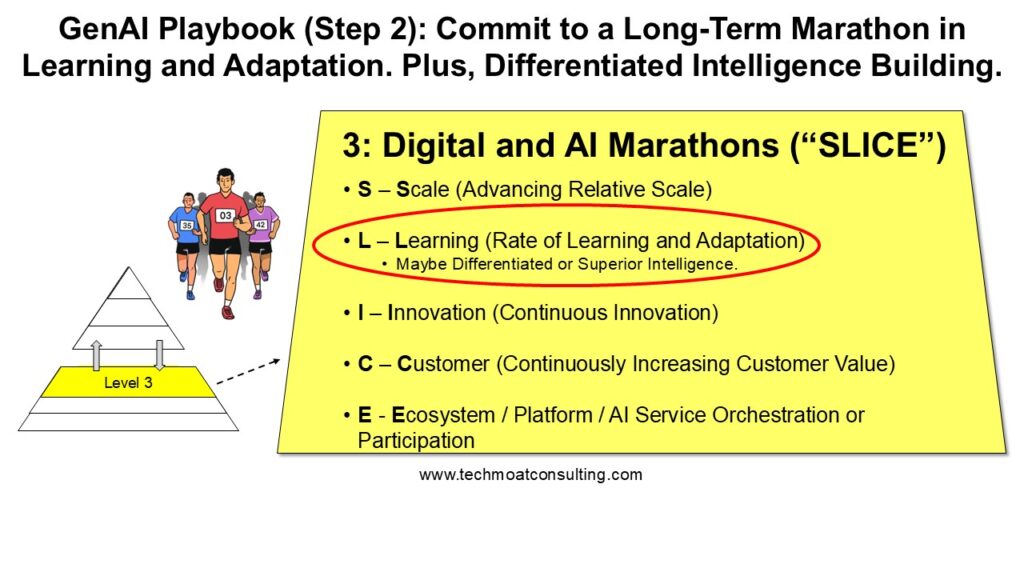
And for Rate of Learning by Humans (different than by machines), I listed Rate of Learning and Adaptation as a key digital marathon. It is an operating activity where you can create a sustainable operating advantage over rivals.
You can basically learn about the market or competitors or customers faster than competitors. And you can adapt faster. This can be very effective in fast changing sectors like fashion and entertainment.
I also put Rate of Learning and Other Process Cost Advantages as a supply-side competitive advantage.
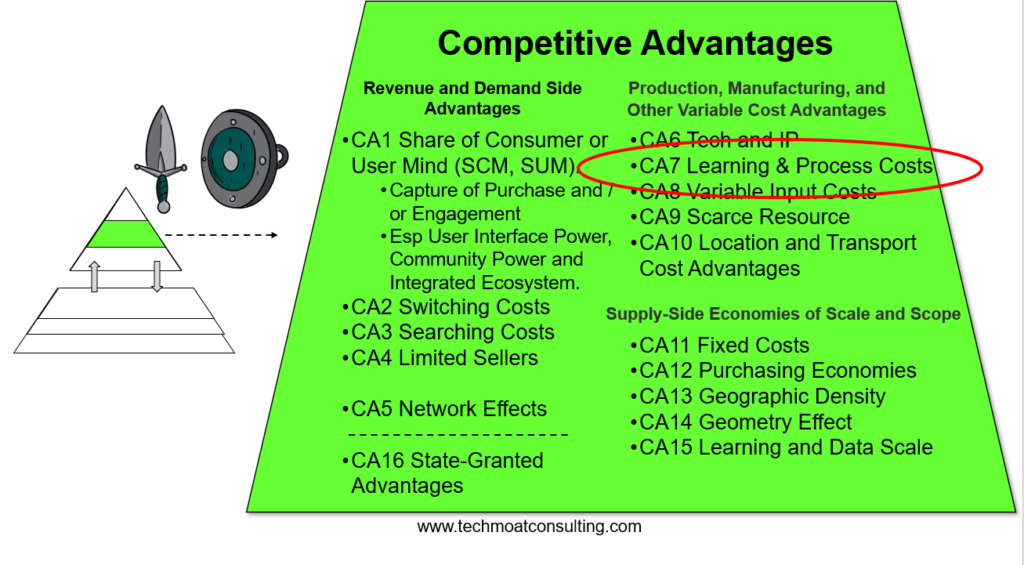
At a certain point, rapid learning and adaptation can play out as a cost advantage in operations with very complicated and informal workflows. It’s a type of process cost advantage.
Those were my conclusions about when Rate of Learning can manifest as a competitive strength.
However, rate of learning is also a big part of standard operating performance for lots of companies.
For example, I wrote about how rate of learning is a big part of Tactics. You need to be able to learn and quickly respond in the constant back and forth between competitors. And between companies and their customers. There are never-ending marketing moves and countermoves. And rate of learning also shows up in new product launches and frequent service changes.
I also put rate of learning in the Digital Operating Basics, I argued that operating performance needs to continually be getting “faster, smarter, better”. This means being more data-driven in both management and operations. This means constant learning about the key operating activities of the business.
Finally, rate of learning is closely tied to experimentation, innovation, and adaptation. You really need to think about all of these together within operating performance. But rate of learning is the foundation.
Overall, we can look at various KPIs for business related to rate of learning. For example:
- How fast can a business learn about changing customer preferences and competitor actions? What happens if one business is doing weekly or monthly customer surveys, but a competitor is tracking customer activity on an hourly or even real-time basis?
- How fast and often can a business experiment with new products, pricing, communication, content, and customer experiences? Experimentation is part of learning. Tech companies like Facebook are running tens of thousands of experiments on the user experience every year.
- How fast and often can a business innovate and create new products and services? Innovation is a separate activity, but it is closely tied to learning.
- Overall, how fast and effectively can a business learn and adapt? In some businesses, like coffee, things are fairly stable, and this isn’t a big deal. But in others, like fashion and entertainment, businesses have to continually adapt.
***
Ok. that’s a summary of how I think about rate of learning by humans. And I factored in that humans are increasingly using digital tools and data to learn faster.
However, learning by machines themselves (i.e., machine learning) is an entirely new thing. That’s what I want to get into in the next articles.
So, let’s start by talking about how learning by humans play out in an organization. This is something that has been studied for over a hundred years. So, this is a good foundation to understand before jumping off into machine learning.
So, let’s start with learning curves and experience effects.
An Introduction to “Learning Curves” for Humans
In 1964, chemical engineering professor Winfred Hirschmann published a Harvard Business Review article “Profit from the Learning Curve”. It began with the following statement:
“Practice makes perfect. A thing can always be done better not only the second time but each succeeding time”
It’s a simple and obvious idea. Humans get better at things the more they do them. Individually, in teams and as an organization.
This idea had been percolating around the psychology and manufacturing fields for about 80 years. It would become a significant part of strategy thinking in the 1970’s.
German psychologist Hermann Ebbinghaus first labeled this phenomenon in 1885, calling it a “learning curve”. Ebbinghaus was studying how proficient people were at memorizing word sets. And he found that proficiency increased in proportion to experience. Basically, people got better at memorizing word sets the more they practiced.
Ebbinghaus plotted proficiency (or learning) on the y-axis of a graphic and experience on the x-axis. He described these graphs as “learning curves”.

Learning curves are about measuring the relationship between proficiency and experience.
- Does proficiency increase with more experience?
- How quickly does it increase?
- Does it flatline after a certain point?
So, at first the learning curve sounds simple:
“a graphical representation of the relationship between proficiency and experience”
But what are the right metrics for experience (the x axis)?
- The number of times a task or process has been done cumulatively?
- Such as the total number of units produced over time. Is this like economies of scale adding up over time? And is this for an individual worker? A small team? A factory? A business? Or an entire industry?
- The number of times a task or process is being done concurrently?
- Such as the real-time output, such as the units produced per hour. By an individual worker, a small team, a factory, a business, or an industry?
- The time spent on an activity?
- Such as the number of years spent overall on a complicated activity. By an individual? By a team? Isn’t this what Malcolm Gladwell calls the 10,000-hour rule?
Also, what are the right metrics for proficiency (learning)? Metrics can include:
- The cost of a task or process?
- And the cost of a series of tasks or processes. Should it be decreasing?
- The time required to complete a task?
- Should things be happening faster? This can tie to labor costs but should not impact non-labor costs, such as equipment usage.
- The efficiency or productivity of simple tasks or processes?
- How about for complex processes? Or inter-twining sets of processes?
- The performance of a task or process?
- Should we see higher test scores and improved quality control?
- Advancements and improvements in processes or completed products over time?
- Should we see advancing capabilities? This is close to innovation.
- Expertise in a body of knowledge?
- Should we see increasing intelligence? Such as the growing expertise in a company like TSMC in semiconductors?
Once we figure out the right metrics for the x and y axis, we can plot out how proficiency and learning changes with experience.
And it turns out this is pretty complicated and industry specific.
We can then start to talk about the shape of the curve.
- Do we see a limit to increasing proficiency?
- Does it keep increasing?
Lots of work was done on this in the 1970’s. And it sort of got out of hand. Sometimes experience doesn’t drive performance at all. Or only for a while. Sometimes big investments in experience make a difference and drop the costs. Sometimes not at all. Or only to a point.
It’s all pretty messy in practice.
The key is to understand the mechanisms by which proficiency actually improves with experience. That’s the key.
You need to know the mechanisms between these two things. And just focus on those.
- Are the mechanisms of increasing proficiency with experience different for different products and services? Even within the same business?
- Are the mechanisms of increasing proficiency different for businesses when the operations are mostly about labor (human learning)?
- Are the mechanisms different when the operations are mostly by equipment and fixed assets (factories)?
- How are the mechanisms of human learning changing with increasing data and digital tools?
Ok. One last point on human learning and then I’ll get to machine learning.
Mapping “Experience Curves” in Human Enterprises
In 1936, Engineer Theodore Paul Wright wrote about an industrial learning effect in aircraft production. Working at the Wright-Patterson Air Force Base in Ohio, he noticed that for every doubling of cumulative production, the time to assemble an aircraft reduced by 20%. And it kept improving by about 20% in a consistent manner. This reduction in time spent was mostly in the assembly phase. Assembly was mostly manpower and that was where the learning effect was most noticed.
That learning curve would look like this.
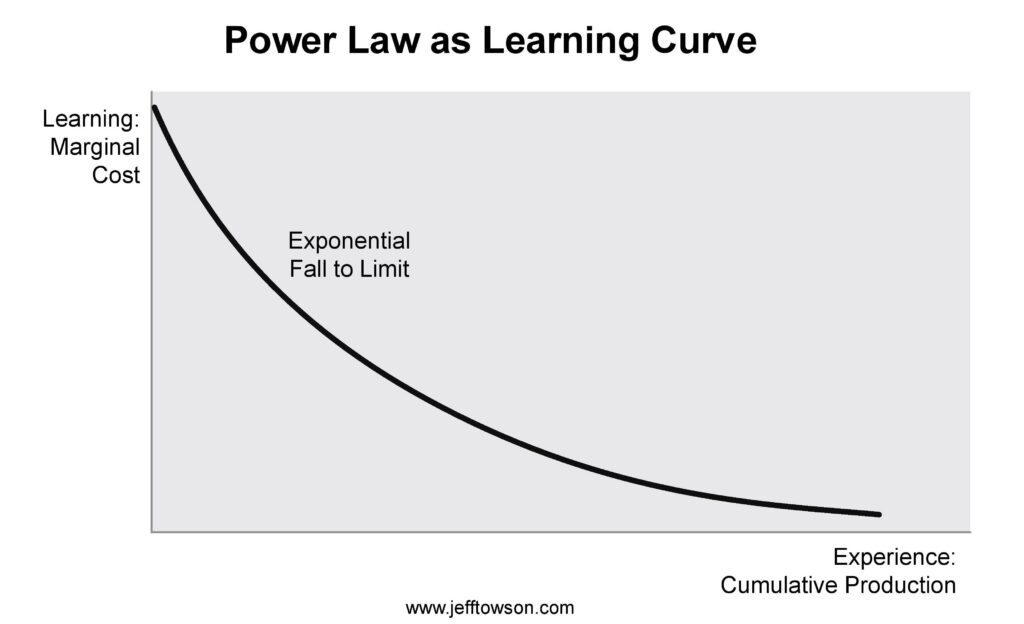
Strategists get very excited when they see something consistently increasing or decreasing by a fixed proportional percentage. That means its exponential. That means its a power law.
And if you plot these types of learning curves logarithmically, you get the straight line, which means there is a fixed rate of improvement with experience. Which looks like this.

That is what Wright found when he looked at unit cost (as a measure of proficiency) for aircraft production. He plotted this against cumulative production (as a measure of experience) and found a power law.
Aviation was really the first industry to study the effect of learning curves on production costs. Other production-heavy industries were then discovered to have similar power law effects, but with different percentage improvements. The size of repeated improvements varied between 1% and 30%.
But what got people (overly) excited was that the percentage improvement appeared constant, and it often did not depend on the scale of the operation.
This is now called Wright’s law (you know I don’t like “laws” in business). It argued that for each doubling of the total quantity of items produced cumulatively, costs decrease by a fixed proportion. Strategists got excited about this apparent power law the same way investors get excited about compound interest.
Over the next decades, this idea was generalized from manufacturing costs to other types of costs. It went beyond just unit costs (per Wright) in production. And it became clear that this related to economies of scale. Scale mattered but there also was a consistent decrease in the variable costs based on the experience of the people involved in production.
This type of learning curve is now called an experience curve. Or the experience curve effect.
BCG did a lot of research on this in the 1970s and showed that the experience effects for many industries can range from 10 to 25%. Bruce Henderson was arguably the leading thinker for the experience effect. According to him, in 1966 BCG began to “attempt to explain cost behavior over time in a process industry”. He argued that two patterns emerged.
- “In one pattern, prices, in current dollars, remained constant for long periods and then began a relatively steep and long continued decline in constant dollars.”
- “In the other pattern, prices, in constant dollars, declined steadily at a constant rate of about 25 percent each time accumulated experience doubled. That was the experience curve.”
You can find lots of charts like this for the experience curve in mass production businesses. The strategic goal is to use experience to decrease costs. It’s almost like a cumulative form of economies of scale.
The slope of the experience curve usually depends on:
- How labor intensive a particular activity is.
- Greater labor intensity means a greater ability for people to learn. The more the activity is about equipment and machines, the less opportunity there is to learn (until recently).
- How complicated and costly a product or service is.
- If the product is complicated, there is more room for improvement and learning.
- If it is costly, there is more room for the costs to fall. The experience curve doesn’t have much effect on cheap and simple goods like pencils. But Toyota is a great opportunity for experience curves.
We can also see the experience curve in operationally complicated service businesses.
For example, hospitals do not have strictly regimented operations. The operating model is more free-flowing and is largely based on putting lots of skilled professionals (doctors, nurses, technicians) in one big building.
Over time, staff coordination on the thousands of different procedures that happen in hospitals becomes smoother and more efficient. Everyone becomes smarter and more efficient. Hospital operating performance gets better and better with cumulative volume. This is why I put rate of learning as a process cost competitive advantage.
Last Point: Track the Input and Output KPIs for Rate of Learning by Humans
Ok. I’ve outlined how rate of leaning by humans historically gets shown as a learning curve, which is:
“a graphical representation of the relationship between proficiency and experience”
Such as these:
That’s how I think about rate of learning by humans. And by humans using digital tools. Both individually, in teams, in enterprises and in industries.
And I’ve outlined the inputs and outputs that matter. The x and y axis of the below graphic have the KPIs for human learning you should track.

On the x axis, we can see the experience inputs that usually matter:
- Cumulative and/or concurrent volume of the task or product.
- Cumulative time spent.
On the y axis, we can see the proficiency outputs that usually matter:
- Increasing efficiency of a task completed, or of a created product. We want to see decreasing cost and / or time spent on a particular process. Or for completing a product.
- Increasing quality and/or performance of a task or product. The task should have fewer errors. The product should be higher quality.
- Advancements or improvements over time. We want to see new and improved products launched. We want to see significant upgrades to work processes.
Those are typically the KPIs that matter for rate of learning by humans. And if we chart them, we can start to see the shape of the learning curve.
In my books, I cited two common types of learning by humans (most of this was BCG thinking). There was:
- Cost-Focused Rate of Learning. Think aviation assembly and building Model T cars. They get cheaper with experience.
- Product-Focused Rate of Learning. Think Steve Jobs. He was good at learning about changing technology and consumer behavior – and quickly and cost-effectively launching new products.
Product-Focused Rate of Learning naturally ties to innovation. You will hear consumer-obsessed companies like Alibaba and Amazon talk frequently about “data plus innovation” as their strategy. But I think they are mostly talking about product-focused rate of learning.
***
Anyways, in Part 5 I’ll do the same approach for rate of learning by machines.
That’s it for today.
Cheers, Jeff
- GenAI Playbook: Rate of Learning by Machines as an Operating Activity (5 of 12) (Tech Strategy)
- GenAI Playbook: A Framework for Generative AI Moats and Strategy (1 of 12) (Tech Strategy)
——-
Related articles:
- AutoGPT and Other Tech I Am Super Excited About (Tech Strategy – Podcast 162)
- AutoGPT: The Rise of Digital Agents and Non-Human Platforms & Business Models (Tech Strategy – Podcast 163)
- The Winners and Losers in ChatGPT (Tech Strategy – Daily Article)
From the Concept Library, concepts for this article are:
- Competitive Advantage: Rate of Learning and Process Cost Advantages
- Digital Marathon: Rate of Learning and Adaptation
- Learning Curves and Experience Effect
- GenAI and Agentic Strategy
- GenAI Playbook
From the Company Library, companies for this article are:
- n/a
——-
I am the founder of TechMoat Consulting, a consulting firm specialized in increasing digital growth and strengthening digital AI moats. Get in contact here.
I write (a lot) about digital growth and digital AI strategy (3 best selling books, +2.9M followers on LinkedIn). There is a free book and email newsletter below.
My Moats and Marathons book series is a framework for building and measuring competitive advantages in digital businesses.
This content (articles, podcasts, website info) is not investment, legal or tax advice. The information and opinions from me and any guests may be incorrect. The numbers and information may be wrong. The views expressed may no longer be relevant or accurate. This is not investment advice. Investing is risky. Do your own research.