
A quick recap.
I have broken moats (i.e., structural advantages) into three levels.
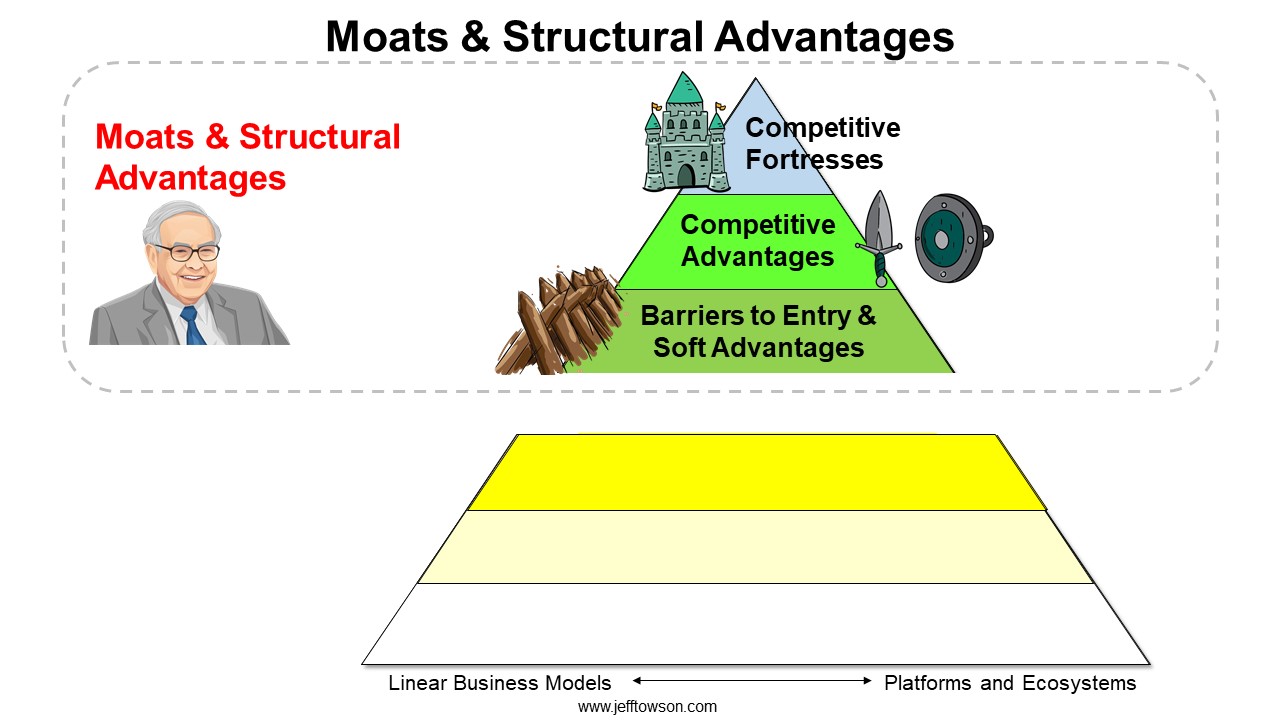
I wrote some recent articles on Barriers to Entry and Soft Advantages:
As discussed, these can create strength against both rivals and new entrants. But this list tends to change fairly frequently. Digital platforms, in particular, are creating lots of new soft advantages and entry barriers. And new digital tools tend to be the most disruptive to traditional barriers to entry.
But it is the next level up, competitive advantages, were companies can get particularly durable defenses.
Two Metrics for Competitive Advantages
These are stronger. Competitive advantages provide ongoing strength and defensibility against existing competitors. These can be both small and large rivals. There are much fewer of these advantages but this is where a company really wants to be. However, you also have to keep an eye out for substitutes.
For competitive advantages, I am looking to see evidence of a moat in the following metrics over time:
- A (ROIC – WACC) that is higher than competitors on average. This is sustained, higher-than-industry-average economic profitability as measured by return on invested capital (ROIC). After subtracting the weighted-average cost of capital (WACC). I am looking for significant and sustained differences in the economic profitability (ROIC-WACC) of various market participants.
- Market share and entry stability, by revenue and/or demand, relative to competitors. I am looking for share stability over time. This means a low change in the average market share exchanged among participants on a yearly basis. This can be measured for revenue and/or demand. Also, I am looking for few new entrants and/or lots of failed entry attempts.
Market share stability tends to be the better measure of pure defensibility. If there is a lot of stability, even in the face of repeated attempts by rivals and new entrants, then the company must be doing something right. It is basically the definition of competitive defensibility.
- Higher economic profitability is a bit more complicated as it also incorporates average industry profitability and external factors such as substitutes and industry growth.
For market share and entry stability, I typically ask:
- Are new entrants able to enter and take market share? How often has this happened? How many attempts have been made and what is the success vs. failure rate?
- Does market share shift between incumbents on a yearly basis? How much per year is normal?
- Across the industry?
- Between just the larger companies?
- Between just the smaller companies?
- Does the total market share of the leaders remain stable versus smaller rivals?
- Is this picture similar or different for revenue vs. demand?
5 Types of Competitive Advantages
In the short-term, profits and ROIC can move significantly. It depends on factors like the growth rate and phase of industry and/or product cycle. Credit and consumer cycles can also move this number. So can good versus bad management. So can luck.
But over the longer-term (1-2 business cycles), you can see certain companies with a higher average ROIC-WACC than competitors. That is what I am looking for.
However, this does not mean the economic profitability is high overall. It is a difference between rivals. But the baseline for an industry can still be high or low. Some companies with big competitive strength and defensibility can have high economic profits. These can be good for creating economic value. Others can have small but protected economic profits. These companies can be good for preserving value.
The standard description is:
ROIC = (Revenue – Cost) / Invested Capital
However, this is only about operating performance, not financial returns. So, technically, the equation is:
ROIC = (Operating Revenue – Operating Cost) / Invested Capital in Operating Assets
ROIC = NOPAT / Invested Capital in Operating Assets
NOPAT is net operating profits after taxes.
The standard argument is that for ROIC-WACC to be higher than competitors over time, the operating revenue has to be higher or the operating costs have to be lower in the same business. So competitive advantages must be revenue and/or cost advantages.
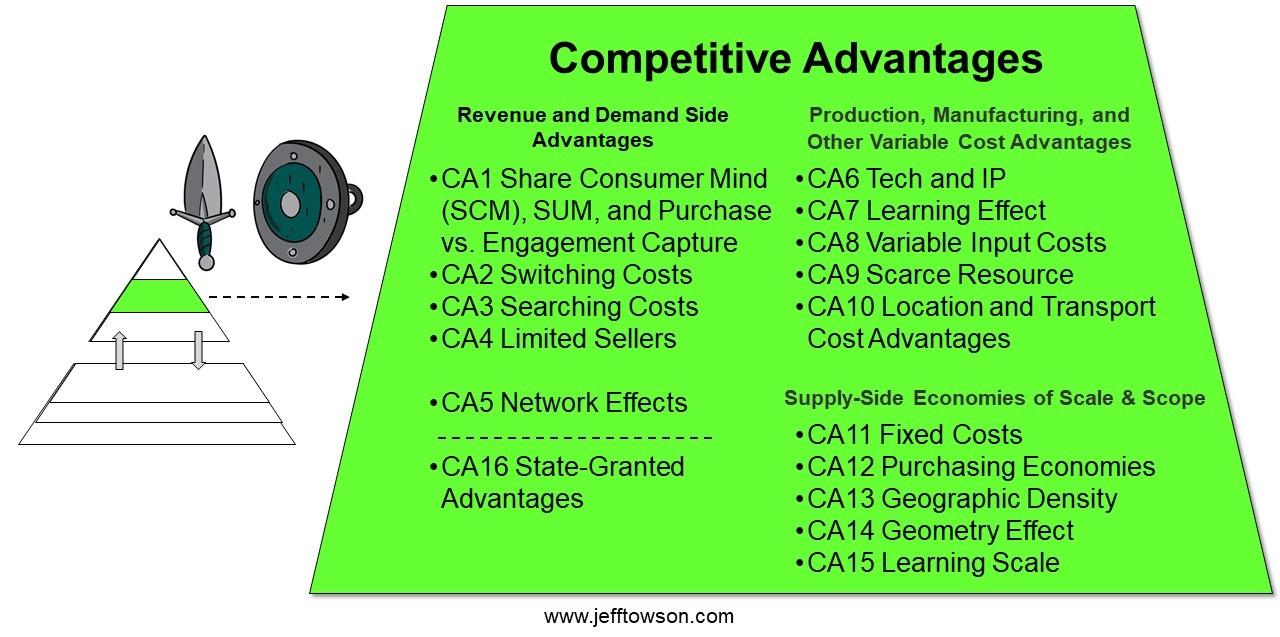
We can define 5 categories of competitive advantages based on this.
- Revenue and Demand Advantages. These can be captive customers, control over pricing, repeat purchases and other phenomenon on the revenue and demand side.
- Network Effects. Also called Demand-Side Economies of Scale. This is a sub-type of revenue and demand advantages, but worth breaking out separately.
- Production, Manufacturing and Other Variable Cost Advantages. These are cost and supply advantages at any volume of activity.
- Supply-Side Economies of Scale and Scope. These are cost and supply advantages based on greater volume than a competitor.
- State-Granted Advantages. These are a much bigger deal that most people think.
In the previous chapters, I went through 1 and 2, which covered the revenue and demand advantages (including network effects). You can see these on the left side of the below graphic. In the following chapters, I will go through the cost and supply competitive advantages, which are on the right.
An Introduction to Cost and Supply Side Advantages
Having a sustainable advantage in cost and/or supply generally shows up in a couple of ways.
- The company has resources or supplies its competitors do not have – or that can only be acquired at significantly higher costs.
- The company has similar resources as other competitors but can produce or utilize them at a lower cost per unit.
So, you really want to think about both cost and supply. Both can actually be important.
You’ll notice for competitive advantage, I have put the symbol of a sword and a shield (see previous graphic). Because they can often be used for both offense and defense.
With a cost advantage over rivals, a company may:
- Price lower than competitors to protect or to expand market share.
- Price similar to competitors and use the extra cash flow strategically – such as by increasing marketing, logistics or R&D spending.
- Price similar to competitors and take higher than normal profits (benefit shareholders).
A good example of 1 and 2 is how Amazon and JD have been doing strategies of “profitless growth” for decades. They use their cost advantages over both offline and online retailers to keep their prices below competitors. This protects and expands market share. But, at the same time, they flood money into IT, logistics and R&D. This strategic spending gives them greater and greater advantages over time. This combination of offense and defense has resulted in continual growth and market share expansion while perpetually showing zero net income. Hence the term “profitless growth”.
In contrast, Costco passes most of its cost advantages on to consumers as lower prices. The goal is to be the lowest cost producer in the markets. Matching their prices is exceptionally difficult. But getting under their prices and taking their market share is impossible.
Variable Cost Advantages Are Much Cooler Than Everyone Thinks
As soon as you talk competitive advantages in costs, everyone jumps to “economies of scale”. And usually to economies of scale based on fixed costs. The favorite example in digital is how Netflix has a massive global user base so it is able to spread its content production fixed costs across these users in a way smaller rivals cannot.
But there is another type of cost advantage nobody talks about much: variable cost advantages. This is when a company has a lower per unit cost, regardless of volume. You don’t need to have more volume than a competitor for this advantage.
Variable cost advantages have traditionally been about costs in manufacturing and production. So, think big factories producing at a lower cost per unit at any volume. In fact, these have often been called production cost advantages.
However, it’s gotten more complicated as goods have increasingly become produced by a combination of physical assets and software, technology and intellectual property. And the goods being “produced” are increasingly services and digital goods. So I use the title “Production, Manufacturing and Other Variable Cost Advantages”.
Accounting statements can be particularly unhelpful in this area.
- How do you calculate the variable costs of software production?
- Of physical goods and services produced by software infused businesses?
- Which IT expenditures should be capitalized?
- What about the cost of data acquisition and cleaning?
Calculating the variable costs of production for a company can become difficult really fast. And keep in mind, digital transformation and disruption are usually about attacking the cost structures of established business models. Costs are the favorite target of digital disruptors and software companies have long used digital tools to devastate traditional companies. For example, when WhatsApp made sending text messages free, the world’s consumers came running. When Marc Andreesen says “software eats the world”, he is mostly talking about the cost side of businesses.
And it raises a bigger question. In an increasingly connected world with platform business models and ecosystems, what does “production” look like?
- Distributed production is already the norm for developers and content creators.
- Smart factories are increasingly connecting and working as an ecosystem. For example, after Haier digitized its factories in China, it immediately focused on connecting them and having them work in collaboration.
As traditional production assets become digitized, connected and increasingly smart, how do you achieve a production cost advantage? Will it mostly come from technology capabilities? Is it about having the right mix of digital and traditional assets and economics? Variable costs is a really fascinating area for competitive advantage.
Right now, I am breaking this category down into five types. But things are changing all the time. Here’s my current list.
- CA6: IP and proprietary technology cost and supply advantages.
- CA7: Learning and process cost advantages.
- CA8: Lower variable cost of inputs – including linked and complementary businesses.
- CA9: Scarce or cornered resources.
- CA10: Location and transportation cost and supply advantages.
I go through this in depth in my books. But CA8 and CA10 tend to be the most important in traditional businesses. And CA6 and CA7 tend to be the most important in digital.
***
That’s it for the theory for today. Cheers, Jeff
——-
Related articles:
- How to Think About Web 3.0 Business Models (1 of 2) (Asia Tech Strategy – Daily Article)
- Platform-Protocol Hybrids and Why DeFi is the Center of Web 3.0 (2 of 2) (Asia Tech Strategy – Daily Article)
From the Concept Library, concepts for this article are:
- CA6-10: Manufacturing, Production and Other Variable Cost Advantages
- Competitive Advantages
From the Company Library, companies for this article are:
- n/a
Photo by Colin Watts on Unsplash
——-
I am a consultant and keynote speaker on how to increase digital growth and strengthen digital AI moats.
I am the founder of TechMoat Consulting, a consulting firm specialized in how to increase digital growth and strengthen digital AI moats. Get in touch here.
I write about digital growth and digital AI strategy. With 3 best selling books and +2.9M followers on LinkedIn. You can read my writing at the free email below.
Or read my Moats and Marathons book series, a framework for building and measuring competitive advantages in digital businesses.
This content (articles, podcasts, website info) is not investment, legal or tax advice. The information and opinions from me and any guests may be incorrect. The numbers and information may be wrong. The views expressed may no longer be relevant or accurate. This is not investment advice. Investing is risky. Do your own research.