I have mentioned a few times on the podcast that I use a one page sheet to do an initial estimate for valuation. I got asked about that so I thought I would send it out.
However…
I am not a hedge fund or other type of equity analyst. I do not spend my days updating complicated valuation models and releasing specific price targets. I am not a professional at this.
However…
I also think the standard valuation approach is pretty much nonsense.
I try to approach valuation like Warren Buffett, who doesn’t use a spreadsheet. Or even a calculator. I like valuations you can do on a piece of paper with a pencil.
–
I occasionally teach a valuation course called How to Value a Company Like Warren Buffett, with this approach.
- I do go through the approaches used at investment banks. Which I don’t buy at all.
- I go through the approaches by McKinsey and by NYU valuation guru Aswath Damadaran, which I think are better.
But I like the Buffett approach best. And the class is mostly a workshop where we value lots of companies. Quickly. And nobody is allowed to use a computer. Everyone gets a pen, a simple calculator and an annual report. That’s it.
Later in the course, the students have to go around town and value local businesses (supermarkets, restaurants, etc.) without having any financials. You just to have figure it out on by looking around. Note: Warren Buffett bought Nebraska Furniture Mart without ever seeing its financials.
Overall, I find this sort of pen and paper only valuation to be useful. It prevents you from creating a false type of specificity and accuracy. Plus, it’s fun to be able to walk around town and value companies.
Valuation Like Warren Buffett
Ok. Now I don’t really know how Buffett does it. He has never really said.
But I have tried to reverse engineer his approach based on his comments. And I think he is mostly focused on owners’ earnings over time. And on ruling out certain scenarios. I have summarized the approach in the below slide.
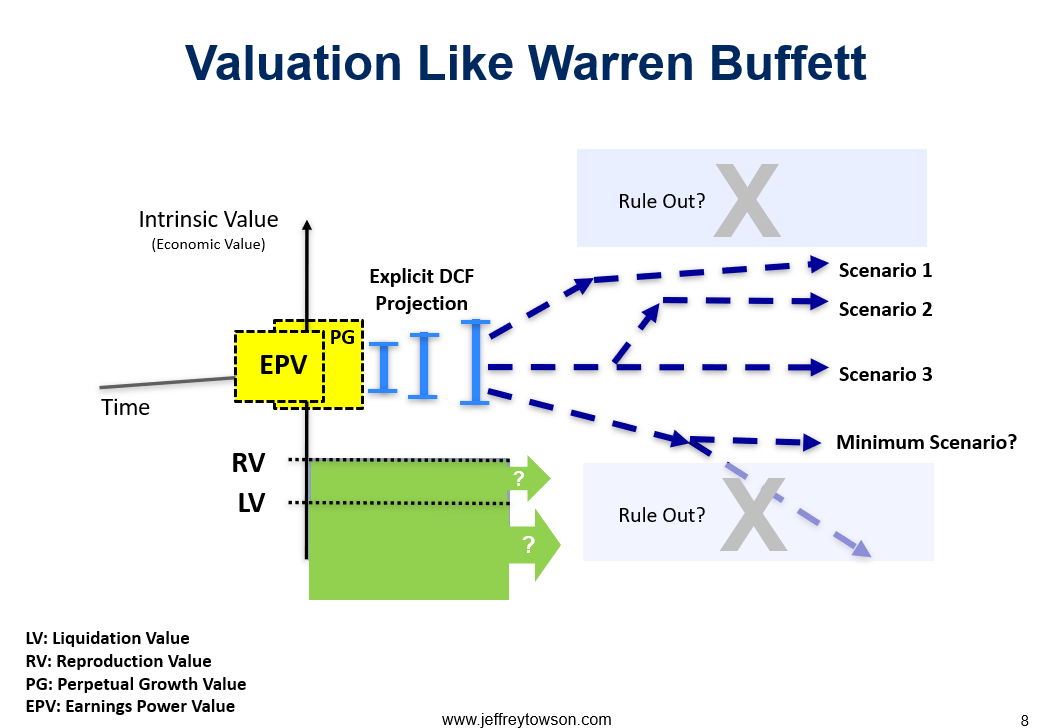
That’s a pretty complicated slide. Let me walk you through it.
This is 8 different types of valuation. Used to box in the most likely true intrinsic value.
- Liquidation Value (LV) and Reproduction Value (RV). These are asset valuations and are shown in green in the graphic. Asset values are not going to tell you what a company is worth. But asset values can be a good minimum floor for intrinsic value. Most all companies are worth more than their asset values. So we can use liquidation and reproduction values to create a minimum valuation for today. And for going forward in time. Liquidation value is almost never useful. But reproduction value can be pretty helpful in most companies.
- Earnings Power Value (EPV) and Perpetual Growth (PG). These are values based on current operating cash flow (EBIT) and are shown in yellow in the graphic (at time=0). This is basically freezing the current state of the business in time. You take the current operating state and assume it continues without any real changes. If you assume zero growth, that is EPV. If you assume a fixed growth rate forever, that is the perpetual growth value.
Neither of those methods are good for actually estimating value. They are bad definitions. Because they assume things won’t change. But they are the best and most solid data. We are only looking at the income statement and balance sheets today and in the past. We are not creating any predictions about the future. These are bad definitions but are limited to the most accurate and reliable information.
From there we start to look into the future.
- Explicit DCF. This is what most people do. They take the current and past operating numbers and then project them forward in time. They do this explicitly for 5-8 years and then add a terminal value. They then discount all the cash flows back to present time. This is the most accurate definition of value. That intrinsic value equals the discounted value of all future cash flow. So the definition is good. But the numbers used are almost completely speculative. It’s made up. In my approach, I do explicit DCF for only about 3-4 years only, which you can see in bright blue in the graphic. I don’t think you can project DCFs into the future any further than that. Although people try to do it all the time.
- Rule-Out Scenarios. This is looking 3-8 years into the future and describing certain scenarios that could exist for this business. I think this is where Warren Buffett lives. I think he creates multiple scenarios in the future and then discounts the cash back from those scenarios to the present time. However, projecting what will happen in the future is very difficult. But predicting what WILL NOT HAPPEN is actually much easier. I don’t know how much I will weigh in 5 years. But I know I won’t weigh below 100 pounds. You can rule out future scenarios far more confidently than you predict what will actually happen. I think this is 50% of what Buffett is doing. I think he is confidently ruling out scenarios. I think he is gets comfortable saying a business will be worth at least x. Then if the price is below that he can invest without risk of loss. This is also why he focuses so much on competitive advantage. Businesses with moats are more protected and give you far better predictability about downside scenarios 3-5 years in the future. It’s also why he avoids businesses with changing technology and customer behavior. He is looking for predictability 3-8 years out. And he is ruling out certain scenarios. You can see this in the graphic in light blue.
- Scenario Building. Once I have good estimates about the current state (EPV, PG) and good boundaries for the future value, I can then just invent 3-4 scenarios within that range. And then discount the cash flows back to today for each scenario. So I am not projecting forward. I am creating future scenarios within a boundary and then discounting them back to figure out what they would be worth. You can also build some optionality into these. You can see these with the dashed lines in the graphic.
I like to use multiple models and come at a question from lots of angles. This approach gets me 6-7 models for valuation. And that is often enough to get a general range. That’s the point of putting it in one graphic. You can see all the models sort of circling around the value. The real intrinsic value is somewhere in the middle. And it is a range. Not a specific number.
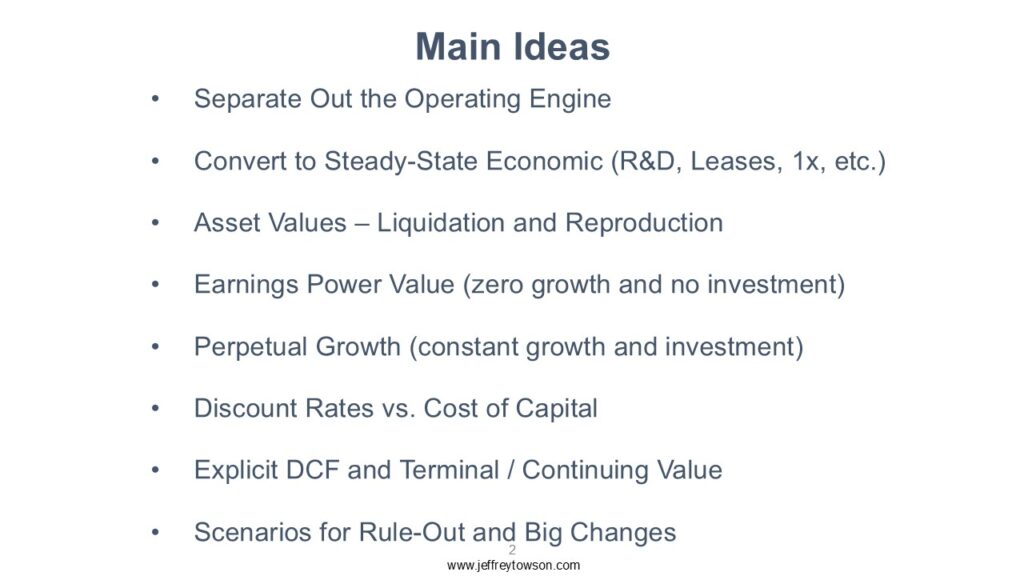
Here’s a summary of the main ideas.
My Sheet for Calculating Intrinsic Value
With that approach, how do you do the valuation calculation?
Here are the steps for valuation by NYU Professor Aswath Damadaran.

That’s a good list to follow. I mostly focus on separating out the operating engine from the financial assets.

Then I redo the basic operating performance. I remove one-time charges. I remove cyclicality. I capitalize leases and R&D. I basically get a steady-state picture of core operating performance at time = 0. And I fill out the below chart. This is my one pager.

The blue box on the left is for the steady-state operating performance. This is where I start. This is for setting the operating baseline for year 0 and year 1. You can see I do the same thing with operating assets in the red box at the bottom. I try to have a clear picture of baseline operating performance, which is often quite different than accounting statements. I want a clear picture of the current operating income resulting from the current operating assets.
Then I do the grey box in the center. This is where I calculate all the other valuation approaches. You can see everything I just mentioned from the Buffett chart. EPV, PG, LV, RV, etc. But really it is the future scenarios and rule out scenarios that are the most important. I can either do a quick DCF or just a multiple for year 5 or so. I can also do a EPV or PG for year 5.
Finally, on the far right, I put back the non-operating assets, which can be important sometimes.
That’s pretty much it. I have a bunch of these printed out and just do it with a pen and a 10k. I get a basic range for intrinsic value. And then I decide whether to go further. This quick process also gets me a sense of whether I can really figure this one out. Before spreadsheets start getting built.
In my class, here is what I ask each student to present for each business.
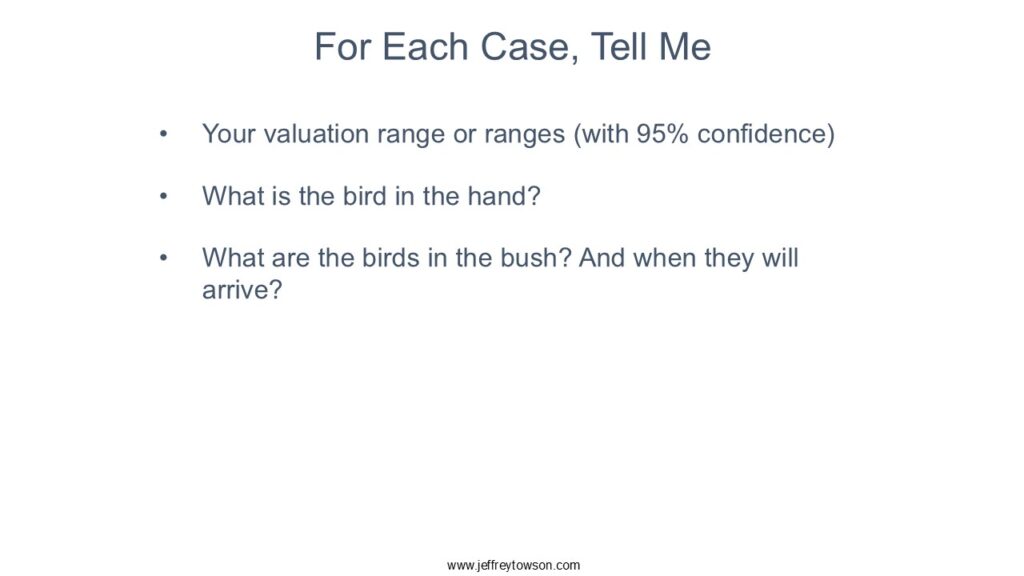
You’ll note I didn’t address catalysts and other short-term events. Those can be really important. But they don’t really relate to my focus on competitive advantage, which is a longer-term force.
That’s it. Let me know if this helps.
Cheers, -jeff
——
Related articles:
- An Intro to Digital Valuation (Asia Tech Strategy – Daily Lesson / Update)
- Can Dingdong Win in Groceries and Specialty Ecommerce? (Asia Tech Strategy – Podcast 90)
From the Concept Library, concepts for this article are:
- Valuation
From the Company Library, companies for this article are:
- Warren Buffet / Berkshire Hathaway
———–